Sizing and Constraint Analysis
To find an equation that represents the wing and power loading, a relation between the specific excess power, , and the associated specific energy, , can be determined. Analysis by Brandt, 2004 provides the required master equation for aircraft performance across several mission stages and is defined as
The above equation can be simplified for our case by assuming a value equal to due to the operation of the aircraft at a single weight throughout all mission stages. Additionally, by considering only the mission stages occurring at a constant altitude and velocity, the final two terms can be dropped. A slight modification, taken from Sadraey, 2020, can also be made to return a Power Loading value, rather than a Thrust Loading value, by considering the aircraft speed and propeller efficiency. This results in the final master equation
Also from Brandt, 2004 is the equation for aircraft performance during take-off. This constraint is formed through a rearrangement of the take-off distance equation which considers the time required to reach take-off velocity and therefore the associated distance. Writing in terms of Power Loading and Wing Loading results in the equation shown below. Note that it considers the forces encountered at to allow for the possibly significant acceleration and deceleration variations.
where is taken as , where is the stall speed, as specified by Brandt, 2004. Similarly, aircraft performance during landing is based on the landing distance required Brandt, 2004. The nature of the mission stage however removes the thrust or power term from the equation, and so the resulting calculation, shown below, is in terms of Wing Loading only.
The values for the zero lift drag coefficient (), the maximum lift coefficient () and propeller efficiency () were set using advised ranges for small, fixed-wing UAVs by Sadraey, 2020. was given ranges for both retractable and fixed landing gear set-ups, the intersection point of the two ranges was taken as an initial estimate. was given a range between 1.2 and 1.6; 1.2 was chosen for the sizing process to remain conservative, similarly was taken to be the minimum efficiency value suggested in the typical range which - 60% [Sadraey, 2020].
To determine the value of the induced drag coefficient () it was necessary to set a suitable aspect ratio (AR). An AR of 6.4443 was selected by analysing the trend between aspect ratio and payload for aircraft taken from the market research, and setting a desired payload of 4 kg as outlined in BMFA, 2021. Some configurations were removed due to their nature differing greatly from the BMFA challenge. Such exclusions were due to factors including lack of payload or an aircraft being a commercially available as opposed to one that was designed specifically for competition. With a set aspect ratio, it was possible to use an empirical formulation for the Oswald efficiency factor () outlined in Nita, 2012 which is as follows:
This yields , can then be derived directly from to result in an induced drag coefficient of \num{1.169} by making use of the following equation [Sadraey, 2020].
An initial estimate was made for the maximum cruise velocity in a similar way to the aspect ratio, whereby the cruise velocities of suitable aircraft from the market research were plotted against the respective payloads and the desired 4kgs payload was applied to the trend to return a cruise velocity of 15.84ms. Both cruise conditions in figure 2 are found using the master equation with a load factor () of , but the turn/hold condition has a differing value of that relates to the velocity and turn rate, , and follows Gudmundsson, 2014:
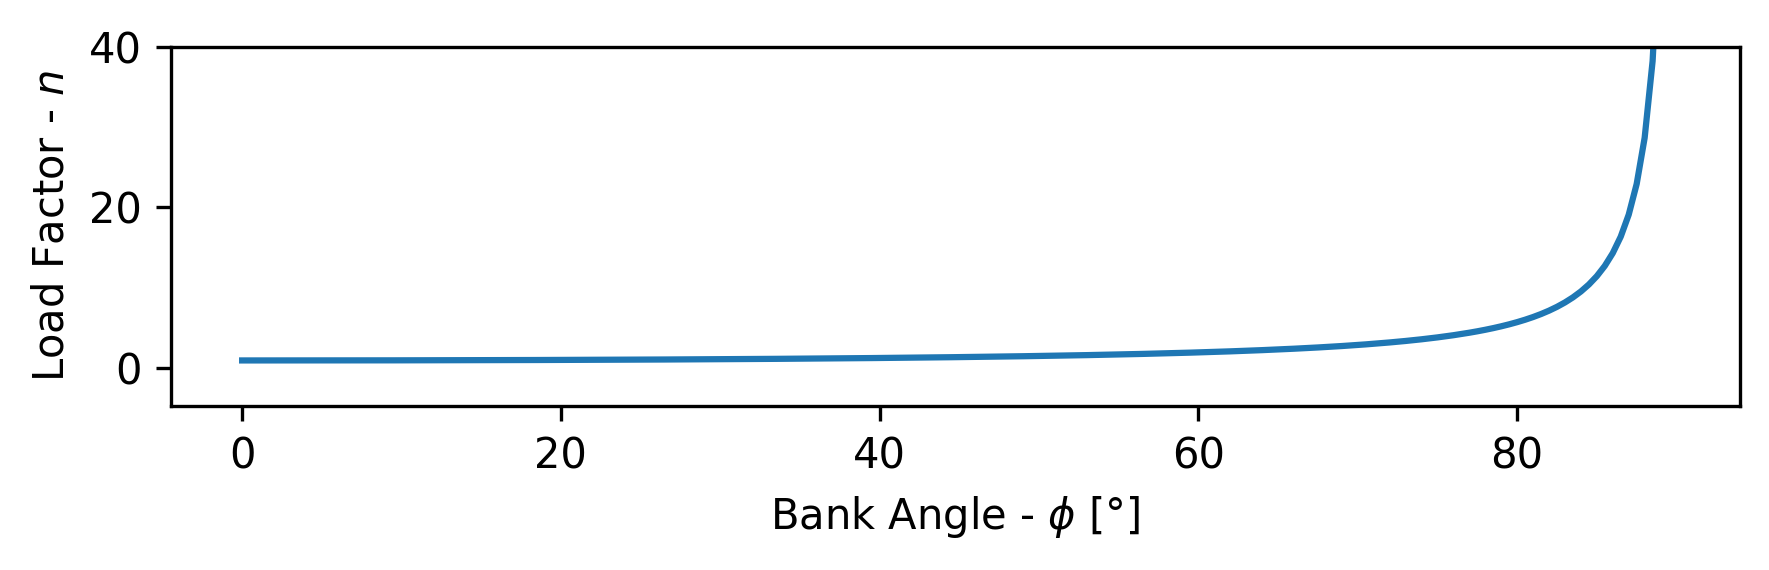
To determine a suitable turn rate, the relationship between load factor and bank angle was observed as shown in figure 1 which represents the below equation, outlined by Gudmundsson, 2014. The velocity of the turn was set at 70% of cruise velocity, and maximum bank angle () of 50 degrees was selected to remain in the region of Figure 1 where the load factor is suitably low for structural safety, however, as there will be no passengers to experience the discomfort associated with a high load factor, the value can be higher than typically found in commercial aviation. The load factor input to the turn/hold sizing equation was 1.5557 which yielded a turn rate of 71.04 degrees per second. This was deemed appropriate for an RC UAV.
An initial estimate for the take-off field length of 15m was made by reviewing footage of previous BMFA competition take-off runs and the standards of similar competitions such as the AIAA flight payload challenge. The landing field length was assumed to be two thirds of the take-off field length as assumed in second year lecture notes [City, 2019], and the friction coefficient of grass related to the take-off equation () was found to be 0.8 by Cenek, 2016. The final consideration that was made for the take-off and landing manoeuvres was for the approximate increment in the zero lift drag coefficient due to the deflection of a flap (), which is estimated to be around \num{0.01} for a small, radio control, fixed-wing UAV as outlined by Sadraey, 2020. A complete table of parameters used in the constraint analysis can be found at the end of this page.
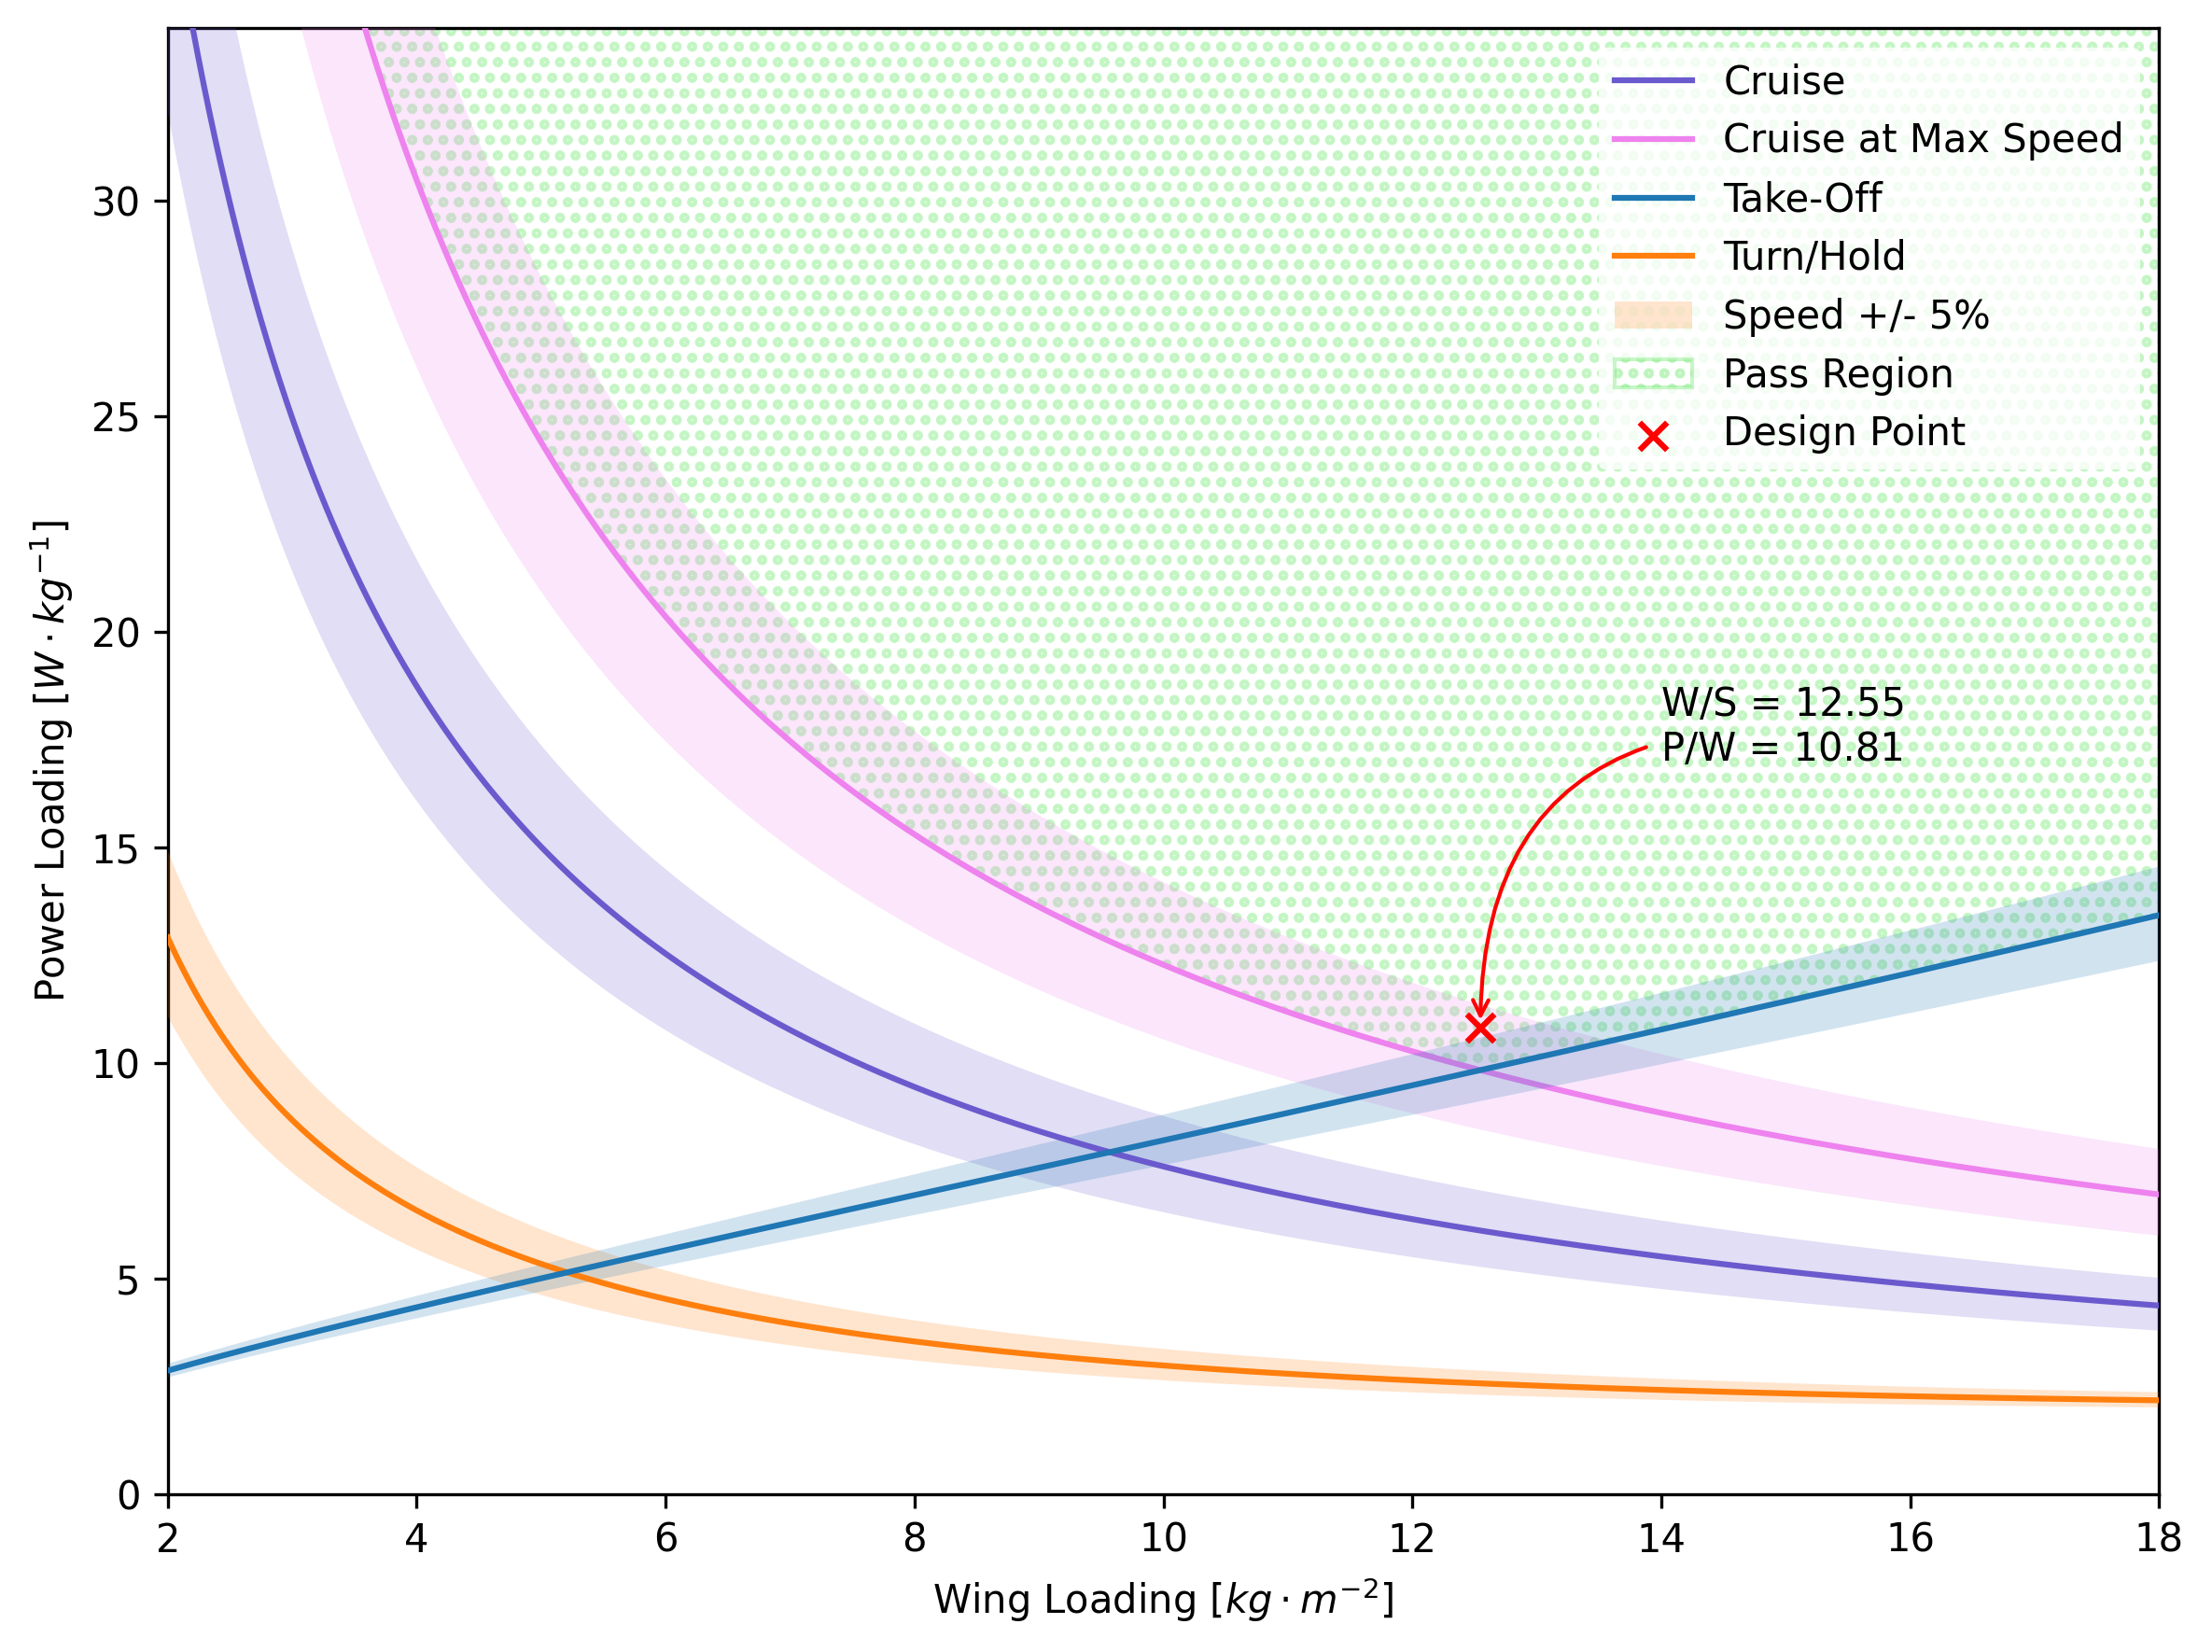
Figure 2 contains the ratio of Power and Wing Loading during different flight conditions including cruise, take-off, and a turn/hold manoeuvre. The highlighted regions surrounding each flight condition outline a safety margin of 5% in the respective manoeuvre velocity. The value of the selected Power Loading must be greater than the constraints of the cruise at max speed and take-off, the area for which is indicated by the pass region. The Wing Loading is also limited by the max cruise speed and take-off as the selected design point must lie in the area bounded by them - the other constraining factor for Wing Loading would be the landing. The landing curve was removed from the plot as the value of Wing Loading for a given landing field length of 10 m was 67.5 kgm, this would appear as a vertical line restricting the Wing Loading but its large value suggests it has no impact on the selection of the design point. The optimum design point would be at the intersection of the cruise curve and the take-off line, which would indicate a wing loading of 12.55 kgm but the power loading was taken to be 10.81 Wkg giving a 10% margin of error from the intersection point. This Wing Loading falls well within the expected values from the market research where the average Wing Loading for aircraft with missions similar to that outlined in BMFA, 2021 was 10.37 kgm. This suggests that the method used to select the design point and the parameters that were set to achieve the sizing diagram were suitable and can be considered accurate.
Constraint Analysis Parameters#
| Parameter | Value | Units |
|---|---|---|
| Mission Requirements | ||
| Take-Off Field Length | 15 | |
| Landing Field Length | 10 | |
| Flight Level | 150 | |
| 0.8 | ||
| Aerodynamic Constants | ||
| Cruise | 0.03 | |
| $C{L\text{max}} | 1.2 | |
| $k_\text{cruise} | 1.169 | |
| Aspect Ratio | 6.4443 | |
| 0.6 | ||
| Low Speed Constants | ||
| 1.2 | ||
| 0.01 | ||
| 1.2 | ||
| 0.01 | ||
| Cruise Constants | ||
| Cruise Speed | 13.46 | |
| Max Speed | 15.84 | |
| Hold/Turn Constants | ||
| Turn Speed | 9.43 | |
| Turn Rate | 70.04 |